| Savneet Singh | PAR Technology Corporation | ||
| Chief Executive Officer and President | 8383 Seneca Turnpike | ||
| New Hartford, NY 13413 | |||
 |
April 23, 2019[●], 2020
Dear PAR Technology CorporationFellow Stockholder:
I am pleased to invite you to PAR Technology Corporation’s 20192020 Annual Meeting of Stockholders, which willto be held on Monday,Thursday, June 10, 20194, 2020 at 10:00 a.m. (local time)(Eastern Time). In light of the coronavirus outbreak (COVID-19), the protocols that federal, state, and local governments have imposed and may impose, and in the best interests of the health and well-being of our stockholders, employees and directors, the Annual Meeting will be a completely virtual meeting; there will be no physical meeting location.
You will be able to attend and participate in the virtual Annual Meeting via the Internet at www.virtualshareholdermeeting.com/PAR2020, where you will be able to vote your shares electronically and submit questions. You will need to enter the Turning Stone Resort Casino, Tower Meeting Rooms (Birch Room)16-digit control number included on your Notice of Internet Availability of Proxy Materials or on your proxy card or the voting instruction form, 5218 Patrick Road, Verona, New York 13478.to attend the Annual Meeting.
The attached Notice of Annual Meeting of Stockholders and Proxy Statement describe the formal business that we will transact at the Annual Meeting.
Your vote is important. Whether or not you expectplan to attend the virtual Annual Meeting, please vote over theyour shares by telephone, orby the Internet or, if you receivereceived a printed copy of the proxy materials, by completing, signing and dating your proxy card by mail, by completing and returning it in the proxy card, as promptly as possible to ensure your representation at the Annual Meeting. envelope provided. Voting by proxy doesnow, will not deprive you oflimit your right to change your vote or to attend the virtual Annual Meeting and to vote your shares in person.Meeting.
On behalf of the Board of Directors, I would like to express our appreciation for your continued support, interest and investment in PAR Technology Corporation. We look forward to seeing you at the Annual Meeting.
Sincerely,
![[MISSING IMAGE: sg_savneet-singh.jpg]](https://capedge.com/proxy/DEF 14A/0001174947-19-000589/sg_savneet-singh.jpg)
Savneet Singh,
Chief Executive Officer & President
Chief Executive Officer & President

 | |
| PAR Technology Corporation | |
| 8383 Seneca Turnpike, New Hartford, NY 13413-4991 |
NOTICE OF
2019
2020 ANNUAL MEETING OF STOCKHOLDERS
Dear PAR Technology Corporation Stockholder:
The 20192020 Annual Meeting of Stockholders (the “Annual Meeting”) of PAR Technology Corporation, a Delaware corporation (the “Company”, “PAR”, “we”, “us”, or “our”) will be held as follows:
Date: | |||||
Time: | 10:00 a.m. | ||||
Virtual Meeting: | |||||
| To attend and participate in the Annual Meeting, you will need the 16-digit control number included on your Notice of Internet Availability of Proxy Materials or on your proxy card or the voting instruction form. Stockholders will be able to vote and submit questions during the Annual Meeting. You will not be able to attend the Annual Meeting in person. | |||||
Place: | Virtual-only via the Internet at www.virtualshareholdermeeting.com/PAR2020. | ||||
Record Date: | April 8, 2020. | ||||
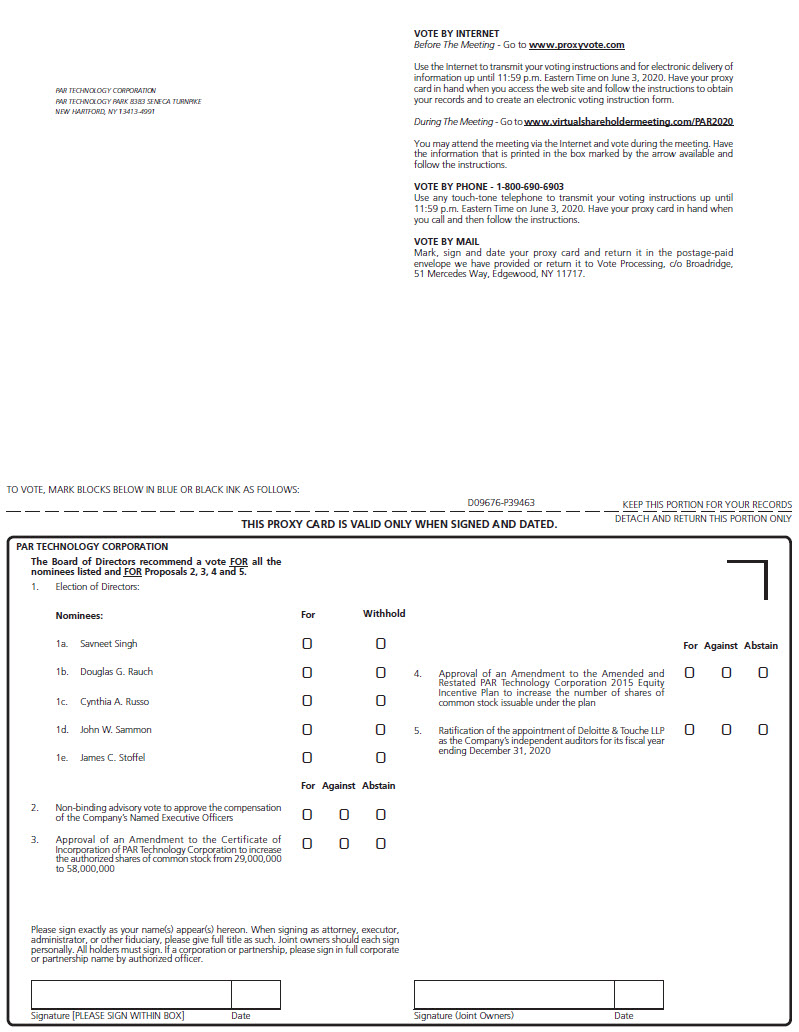
Items of | To elect the five Director nominees named in the accompanying Proxy Statement to serve until the | ||||
| To approve, on a non-binding, advisory basis, the compensation of our named executive officers; | |||||
| To approve | |||||
To approve an amendment to the Amended and Restated PAR Technology Corporation 2015 Equity Incentive Plan | |||||
To ratify the appointment of | |||||
| To transact |
A complete list of registered stockholders will be available at least 10 days prior to the Annual Meeting at our corporate headquarters, 8383 Seneca Turnpike, New Hartford, New York 13413. This list will also be available to stockholders of record during the Annual Meeting for examination at www.virtualshareholdermeeting.com/PAR2020.
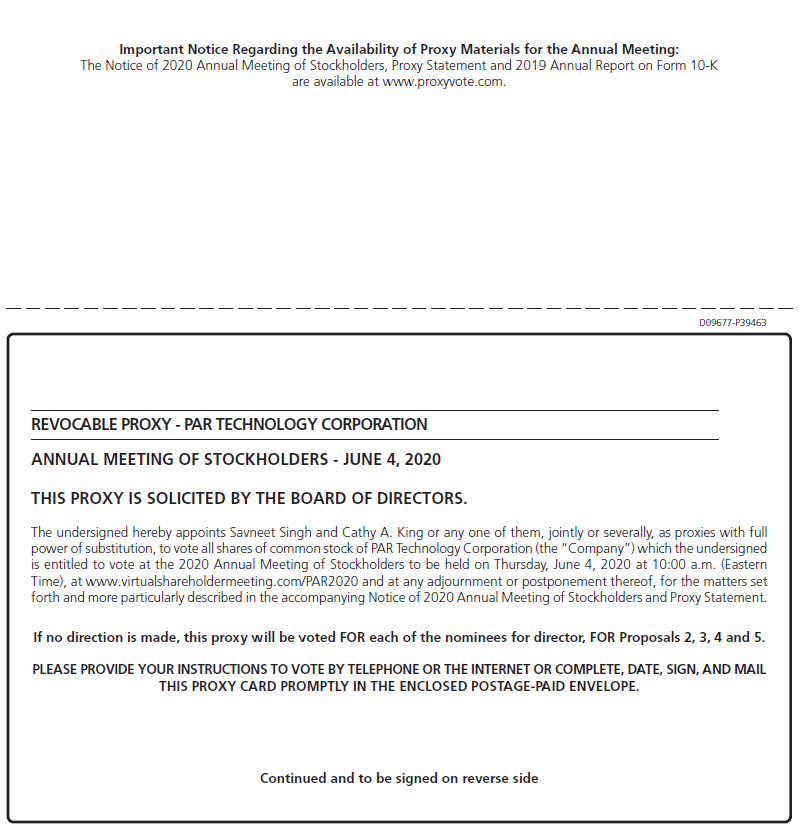
Important Notice Regarding the Availability of Proxy Materials for
the Annual Meeting of Stockholders to Be Held on Monday,Thursday, June 10, 20194, 2020 at 10:00 a.m. (local time) at the Turning Stone Resort Casino, in Verona, New York.(Eastern Time) As of the date of mailing of the.
This Notice of Internet Availability2020 Annual Meeting of Stockholders, Proxy Materials, all stockholdersStatement, and beneficial owners will have the ability to access all of our proxy materials2019 Annual Report on a website referenced in the Notice of Internet Availability of Proxy Materials.Form 10-K are available at www.proxyvote.com.
By Order of the Board of Directors,
Savneet Singh,
Chief Executive Officer and President
New Hartford, New York
April 23, 2019[●], 2020
Whether or not you expectplan to attend the virtual Annual Meeting, please vote over theyour shares by telephone, orby the Internet or, if you receivereceived a printed copy of the proxy materials, by completing, signing and dating your proxy card by mail, by completing and returning it in the envelope provided. Voting by proxy card, as promptly as possiblenow, will not limit your right to ensurechange your representation atvote or to attend the virtual Annual Meeting. Voting instructions are provided in the Notice of Internet Availability of Proxy Materials or, if you receive a proxy card by mail, the instructions are printed on your proxy card. Even if you have voted by proxy, you may still vote in person if you attend the Annual Meeting. Please note, however, if your shares are held of record by a broker, bank, or other nominee and you wish to vote at the Annual Meeting, you must obtain a proxy issued in your name from that record holder.
TABLE OF CONTENTS
i
PAR Technology Corporation
8383 Seneca Turnpike
New Hartford, New York 13413-4991
April 23, 2019[●], 2020
2020 ANNUAL MEETING OF STOCKHOLDERS
To be held June 10, 20194, 2020
This Proxy Statement is being furnished to the stockholders of PAR Technology Corporation, a Delaware corporation, in connection with the solicitation of proxies by our Board of Directors for use at our 20192020 Annual Meeting of Stockholders to be held on Monday,Thursday, June 10, 20194, 2020 at 10:00 a.m. (local time)(Eastern Time) virtually via the Internet at the Turning Stone Resort Casino, Tower Meeting Rooms (Birch Room), 5218 Patrick Road, Verona, New York 13478.www.virtualshareholdermeeting.com/PAR2020. This Proxy Statement and the proxy and voting instruction card or Notice of Internet Availability of Proxy Materials are first being sent or made available to our stockholders on or about April 23, 2019.[●], 2020.
Who is entitled to notice and to vote at the Annual Meeting?
Only stockholders of record of our common stock at the close of business on April 17, 2019,8, 2020, the Record Date, are entitled to notice of, and to vote at, the Annual Meeting. On April 17, 2019,8, 2020, there were 16,252,648[●] shares of common stock outstanding. Each share of common stock is entitled to one vote.
Distribution of Proxy Materials; Notice of Internet Availability of Proxy Materials (the “Notice”).
As permitted by the rules of the Securities and Exchange Commission (“SEC”), on or about April 23, 2019,[●], 2020, we sent the Notice to our stockholders as of April 17, 2019.8, 2020. Stockholders will have the ability to access the proxy materials, including this Proxy Statement and our Annual Report on Form 10-K for the year ended December 31, 2018,2019, on the Internet at www.investorvote.com/PARwww.proxyvote.com or to request a printed or electronic set of the proxy materials at no charge. Instructions on how to access the proxy materials over the Internet and how to request a printed copy may be found on the Notice, and on the website referred to in the Notice, including an option to request paper copies on an ongoing basis. The Notice also instructs you on how to vote through the Internet or by telephone.
Who is paying for this proxy solicitation?
We are paying the costs of the solicitation of proxies. We will reimburse brokers, banks or other custodians, nominees and fiduciaries for their charges and expenses in forwarding proxy materials to beneficial owners. Certain of our Directors, officers and employees, without additional compensation, may also solicit proxies on our behalf in person, by telephone, or by electronic communication. In addition, we have engaged Morrow Sodali LLC to assist in the solicitation from brokers, bank nominees and institutional holders for a fee of $8,000 plus out-of-pocket expenses.
Stockholder of Record; Shares Registered in Your Name.Name.
If on April 17, 20198, 2020 your shares were registered directly in your name, then you are a stockholder of record and you may vote in personon the matters to be voted upon at the Annual Meeting, vote by proxy over the Internet or by phone by following the instructions provided in the Notice or, if you request and receive printed copies of the proxy materials by mail, you may vote by mail.Meeting. If your proxy is properly executed in time to be voted at the Annual Meeting, the shares represented by the proxy will be voted in accordance with the instructions you provide. Whether or not you plan to attend the virtual Annual Meeting, we urge you to vote by proxy to ensure your vote is counted. You may still attend the Annual Meeting virtually via the Internet at www.virtualshareholdermeeting.com/PAR2020and vote in personyour shares if you have already voted by proxy.proxy (see “Can I change my vote after submitting my proxy?” below).
Beneficial Owners; Shares Registered in the Name of a Broker, Bank, or Other Nominee.Nominee.
If on April 17, 20198, 2020 your shares were not registered in your name, but rather in the name of a broker, bank, or other nominee, then you are the beneficial owner of shares held in “street name” and the Notice is being forwarded to you by that organization, which is considered to be the stockholder of record for purposes of voting at the Annual Meeting. As a beneficial owner, you have the right to direct your broker,
![[MISSING IMAGE: tv518916_pc1.jpg]](https://capedge.com/proxy/DEF 14A/0001174947-19-000589/tv518916_pc1.jpg)
![[MISSING IMAGE: tv518916_pc2.jpg]](https://capedge.com/proxy/DEF 14A/0001174947-19-000589/tv518916_pc2.jpg)